The code for this part can be found here. Feeling lost? Consider starting at part 1.
With the content covered up to this point you might have an idea already how conditional or log points can be implemented. Simply wait for a breakpoint hit, read any variables you need from memory, and decide whether to break execution/log something to the console. Most debuggers are in fact implemented this way. However you may have noticed, these types of breakpoints really slow down your program. This is because even if the debugger decides to continue through, the breakpoint was still hit. Execution halted and a kernel round trip was performed.
A kernel round trip refers to how the debugee and debugger interact. Modern CPU’s and operating systems are build on the idea of different protection rings. The least privileged is ring 3, user space, where all our programs operate. The highest privilege is ring 0, the OS kernel.
All exceptions are first handled by the kernel. This means when the debugee hits a breakpoint it has to perform an expensive context switch and wake up the kernel. The kernel inspects the exception and notifies our debugger. But for the debugger to perform actions like ‘read process memory’ or ‘continue running’ it again has to wake up the kernel. Programs in user space are not allowed to touch other programs. Only the kernel can. So each of these actions is a costly operation up and down the protection rings.
To win back performance, can we perhaps avoid triggering an exception in the first place? We only want to break when our condition is true. Taking a cue from hot-reloaders we can! By injecting code into the debugee.
Setup
Our plan will be to replace the code we want to break at with a small piece of assembly that checks the condition. When the debugee executes this code, it will only run the int3 (software breakpoint instruction) when the condition is true. But before looking into that we need to make two small adjustments to code from previous parts.
First we ask for two more bits of data: the address of the value to watch, and the value to compare it against. Our conditional breakpoint will break only when the value to watch is a multiple of the value to compare. I.e. value_to_watch % value_to_compare == 0
// Received the signal the debugee is ready.
if (exception_code == 0xE0000001) {
    log.info("Set conditional breakpoint at address?", .{});
    var input_line_bare = try stdin.takeDelimiter('\n') orelse unreachable;
    var input_line = std.mem.trim(u8, input_line_bare, "\r");
    const break_at_address = try std.fmt.parseInt(usize, input_line, 0);

    log.info("Compare against counter at address?", .{});
    input_line_bare = try stdin.takeDelimiter('\n') orelse unreachable;
    input_line = std.mem.trim(u8, input_line_bare, "\r");
    const address_to_compare = try std.fmt.parseInt(usize, input_line, 0);

    log.info("Break when counter is a multiple of?", .{});
    input_line_bare = try stdin.takeDelimiter('\n') orelse unreachable;
    input_line = std.mem.trim(u8, input_line_bare, "\r");
    const value_to_compare = try std.fmt.parseInt(u32, input_line, 0);

    try setBreakpoint(
        process_id,
        break_at_address,
        address_to_compare,
        value_to_compare
    );
}
Next we upgrade swapProcessByte to swapProcessBytes so we can read/write multiple bytes at once. I’ll skip the implementation of this but it should be easy to imagine.
pub fn swapProcessBytes(
    process_handle: win.HANDLE,
    address: usize,
    byte_count: comptime_int,
    bytes_to_write: [byte_count]u8,
) ![byte_count]u8 { ... }
Injecting new functions
To add our condition we need to inject some assembly into the debugee. But we can’t just insert assembly in the middle of an already compiled function. Not only would we override the existing assembly, there might not even be enough bytes in the function to write out our condition.
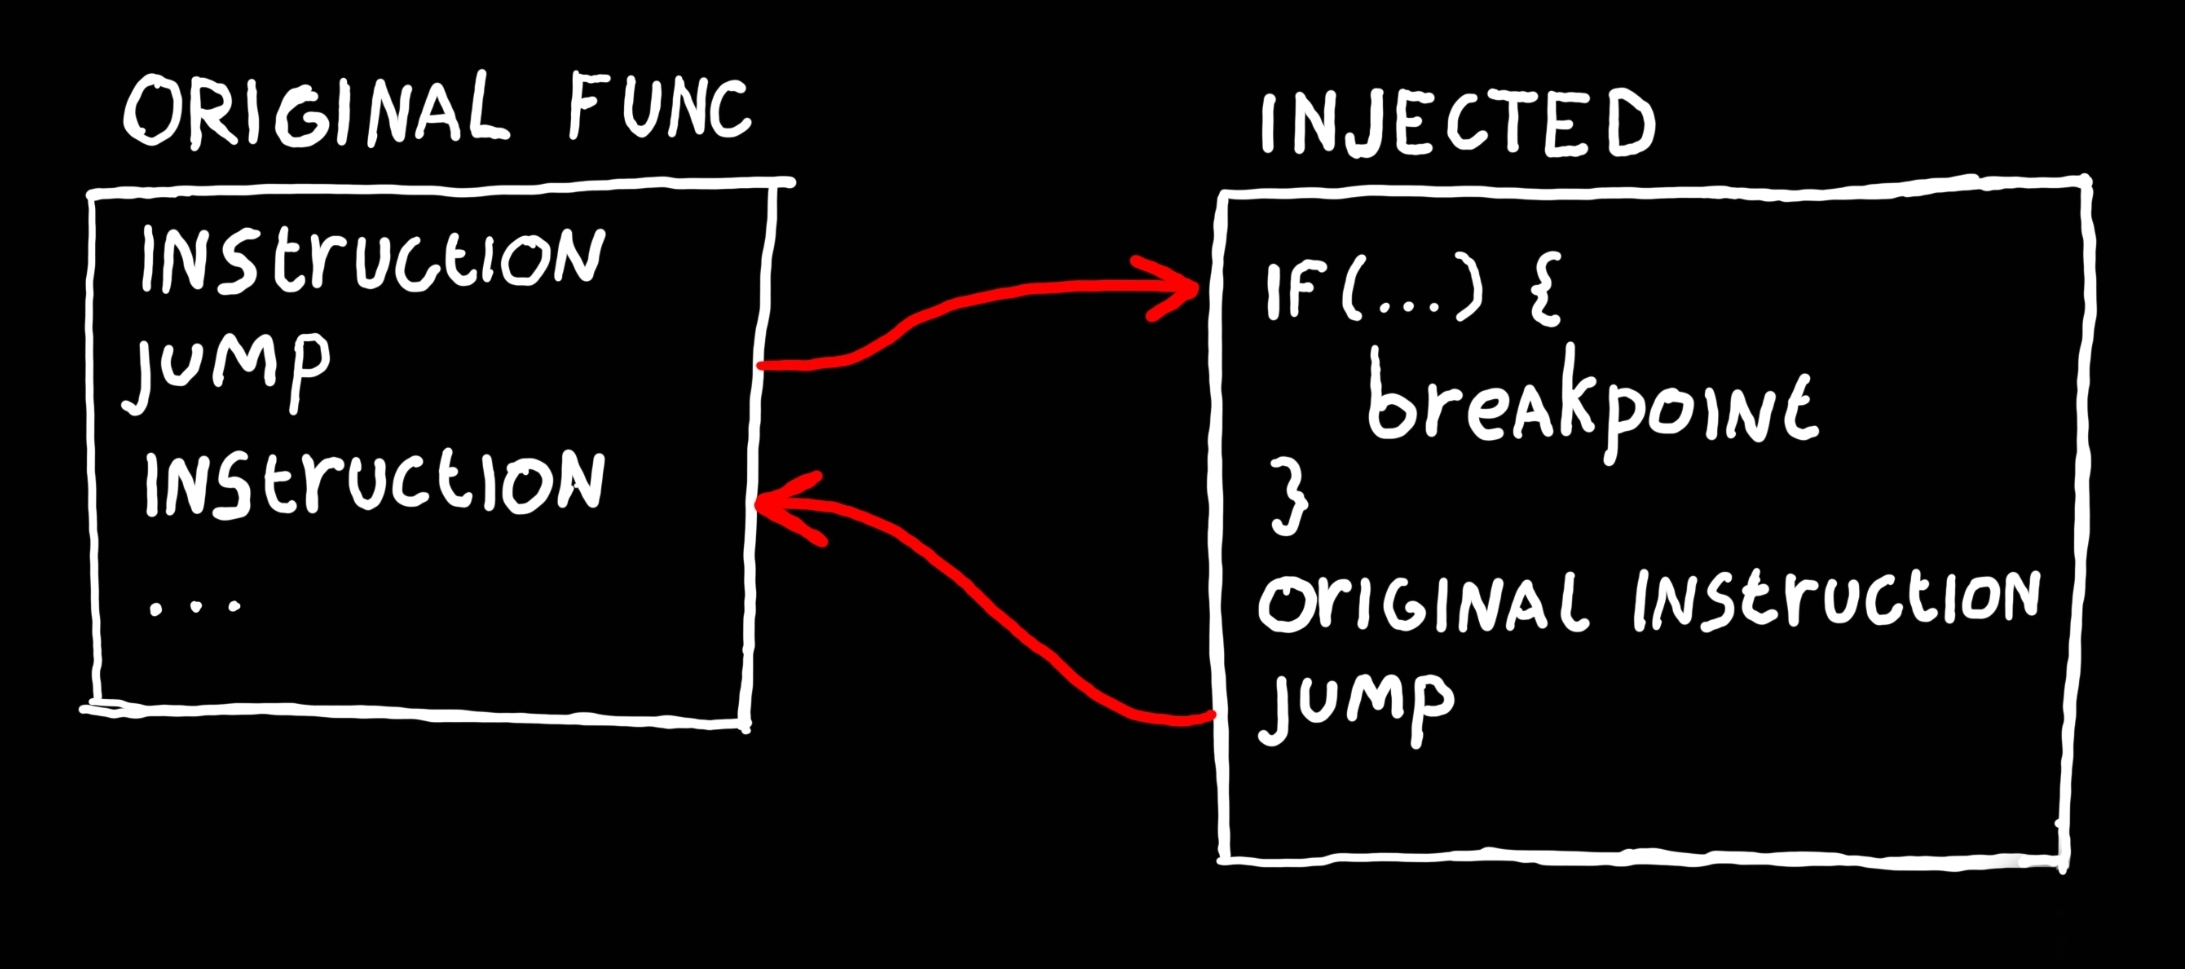
Instead will write a short1 jump instruction at the address to break at. This will jump to a new function we’ve injected into the debugee. Inside this function we’ll put our condition, the breakpoint and the instruction(s) the jump replaced. After executing that it will jump back to where we came from and continue like nothing happened.
The first step is to get some memory from inside the debugee where we can write our new function to. Remember from previous parts that all memory comes in pages. When your program wants some memory from the OS it allocates it through VirtualAllocEx. This returns the address of a new memory page.
Here MEM_RESERVE puts some page(s) aside for us, but not into physical RAM2 yet. MEM_COMMIT than actually allocates them from physical memory3 so they become read/write-able. You’ll also recognise the PAGE_EXECUTE_READWRITE protection flags we add from previous parts. Lastly it’s worth pointing out that while we ask for only 255 bytes, dwSize is always rounded up to the page size.
pub fn setBreakpoint(
    process_id: win.DWORD,
    break_at_address: usize,
    address_to_compare: usize,
    value_to_compare: u32,
) !void {
    // Ensure we obtain the process handle with memory read, write and page alloc permissions.
    const process_access = win.PROCESS_VM_READ | win.PROCESS_VM_WRITE | win.PROCESS_VM_OPERATION;
    const process_handle = win.OpenProcess(process_access, win.FALSE, process_id);
    defer _ = win.CloseHandle(process_handle);

    // Allocate memory inside the debugee process to inject the assembly
    // of a new function into.
    var new_function_to_inject: [255]u8 = undefined;
    const new_function_addr = @intFromPtr(win.VirtualAllocEx(
        process_handle,                                 // hProcess
        null,                                           // lpAddress
        new_function_to_inject.len,                     // dwSize
        win.MEM_RESERVE | win.MEM_COMMIT,               // flAllocationType
        win.PAGE_EXECUTE_READWRITE,                     // flProtect
    ));
Next we replace the instruction(s) at the address to break at, with a jump instruction. We use a 64-bit RIP-relative indirect jump, which for reasons we discuss later you normally probably wouldn’t. But it’s an easy instruction to understand. When executed it will first read the value at [rip + 0], than jump to that value. rip is the current instruction pointer, so + 0 means read the value immediately after this.
In this case we write a jump to the start of our new function memory, and remember the bytes we overwrote.
    // Replace the code at the location of our breakpoint with a jump
    // instruction to the injected function.
    var jump_instruction = [14]u8{
        0xFF, 0x25, 0x00, 0x00, 0x00, 0x00,             // jmp qword, [rip + 0]
        0x00, 0x00, 0x00, 0x00, 0x00, 0x00, 0x00, 0x00, // `addr_to_jump_to`
    };
    @memcpy(jump_instruction[6..], std.mem.asBytes(&new_function_addr));

    const original_bytes = try swapProcessBytes(
        process_handle,
        break_at_address,
        jump_instruction.len,
        jump_instruction,
    );
Building our function
Next we have to write out our function body. Usually you can invoke a compiler, but we’ll create some artisanally4 hand-crafted assembly instead:
pub fn buildFunctionToInject(
    result_buffer: []u8,
    address_to_compare: u64,
    value_to_compare: u32,
    orginal_address: u64,
    orginal_bytes: []const u8
) void {
    var code: std.ArrayList(u8) = .initBuffer(result_buffer);
    const add = std.ArrayList(u8).appendSliceAssumeCapacity;

    add(&code, &.{
    // Preserve the previous register values.
        0x50, 0x51, 0x52,                   // push rax, rcx, rdx
    });
    add(&code, &.{
    // Read the value stored at `address_to_compare` from memory.
        0x48, 0xB8,                         // mov rax, `address_to_compare`
    });
    add(&code, std.mem.asBytes(&address_to_compare));
    add(&code, &.{
        0x8B, 0x00,                         // mov eax, [rax]
    });
    add(&code, &.{
    // Load the value of `value_to_compare` into a register.
        0xB9,                               // mov ecx, `value_to_compare`
    });
    add(&code, std.mem.asBytes(&value_to_compare));
    add(&code, &.{
    // Calculate eax / ecx, the remainder will be stored in edx.
        0x31, 0xD2,                         // xor edx, edx
        0xF7, 0xF1,                         // div ecx

    // Check if edx is zero. Jump over the breakpoint if not.
        0x85, 0xD2,                         // test edx, edx
        0x75, 0x01,                         // jnz +1

    // Breakpoint.
        0xCC,                               // int3

    // Restore the preserved register values.
        0x5A, 0x59, 0x58,                   // pop rdx, rcx, rax
    });
    // Execute the code we replaced.
    add(&code, orginal_bytes);
    // Insert a jump back to the original code.
    add(&code, &.{
        0xFF, 0x25, 0x00, 0x00, 0x00, 0x00, // jmp qword, [rip + 0]
                                            // `addr_to_jump_to`
    });
    const return_addr = orginal_address + orginal_bytes.len;
    add(&code, std.mem.asBytes(&return_addr));
}
I won’t go too deep into the assembly and hopefully let the comments speak for themselves. Reading assembly could be it’s own series I’m not qualified to write. But have a look at the general structure.
Notice how we jump over the int3 instruction based on a condition. And also notice we how we add the replaced bytes after this followed by a jump back to the original code. Roughly translated you get:
const counter = address_to_compare.*;
const value = value_to_compare;
const division, const remainder = counter / value;
if (remainder == 0) @breakpoint();

originalInstructions();
return;
While this code works for our demo, a real debugger wouldn’t put the int3 before the register pop instructions. These registers might have contained values needed to inspect local variables before we entered this function. Therefore it should restore these register values before breaking. But we’ll prefer to keep things simple.
Finishing our breakpoint
This has been a lot, but we are now basically there. Back in our setBreakpoint function we now simply write the assembly snippet into the process memory.
    // Build the assembly to inject and write it into the debugees memory.
    buildFunctionToInject(
        &new_function_to_inject,
        address_to_compare,
        value_to_compare,
        break_at_address,
        &original_bytes,
    );

    _ = try swapProcessBytes(
        process_handle,
        new_function_addr,
        new_function_to_inject.len,
        new_function_to_inject,
    );

    log.info("Successfully set breakpoint at address 0x{X}", .{break_at_address});
}
You might wonder about the handleBreakpoint function we had in previous parts. But unlike other parts, when we hit our breakpoint, we can just continue through. There is no stepping or swapping of assembly required.
// A software breakpoint has been hit.
if (exception_code == win.EXCEPTION_BREAKPOINT) {
    if (!initial_breakpoint_hit) {
        initial_breakpoint_hit = true;
    } else {
        log.info("Breakpoint hit! Continue?", .{});
        _ = try stdin.takeDelimiter('\n') orelse unreachable;
    }
}
Results
This has been the most complex part yet. But has it all been worth it?.. Yes!
info(debugee): Address of doWork() == 0x7FF631041720
info(debugee): Address of counter == 0x7FF631109600
info(debugee): Waiting for debugger...
info(debugger): Set conditional breakpoint at address?
0x7FF631041720
info(debugger): Compare against counter at address?
0x7FF631109600
info(debugger): Break when counter is a multiple of?
5
info(debugger): Successfully set breakpoint at address 0x7FF631041720
info(debugee): Starting work!
info(debugger): Breakpoint hit! Continue?
y
info(debugee): 0
info(debugee): 1
info(debugee): 2
info(debugee): 3
info(debugee): 4
info(debugger): Breakpoint hit! Continue?
y
info(debugee): 5
info(debugee): 6
info(debugee): 7
info(debugee): 8
info(debugee): 9
info(debugger): Breakpoint hit! Continue?
That brings us to the numerous issues our demo here has. I mentioned earlier how a function might not have enough bytes to replace. And in fact it might not even have enough bytes for a jump instruction. That’s why using a 14-byte jump instruction is not great. It would be better to use something like a 5-byte 32-bit relative jump5. But that requires logic to ensure the page we VirtualAllocEx is close enough to the original code to make the jump. We might also need to depend on certain compiler settings or other tricks to make sure all functions have enough room for at least one jump instruction.
Furthermore, we can’t just replace assembly instructions like this. What if our jump ends in the middle of another instruction? The original instruction would get cut in half and become un-executable. The only reason it worked here is because I inspected the assembly of doWork() beforehand. A real debugger would use a disassembler to find the next instruction boundary and replace up to it.
Because our jump takes up multiple bytes, we also have to now care about code potentially jumping from elsewhere into the area we overwrote. With the int3 instruction it was very convenient it only takes up 1-byte.
We can go on about edge cases that would need to be handled. And ultimately this is why most debuggers don’t use this technique. But there are times where repeatedly halting is unacceptable. So I would love to see some of the big players throw their infinite piles of cash at the problem.